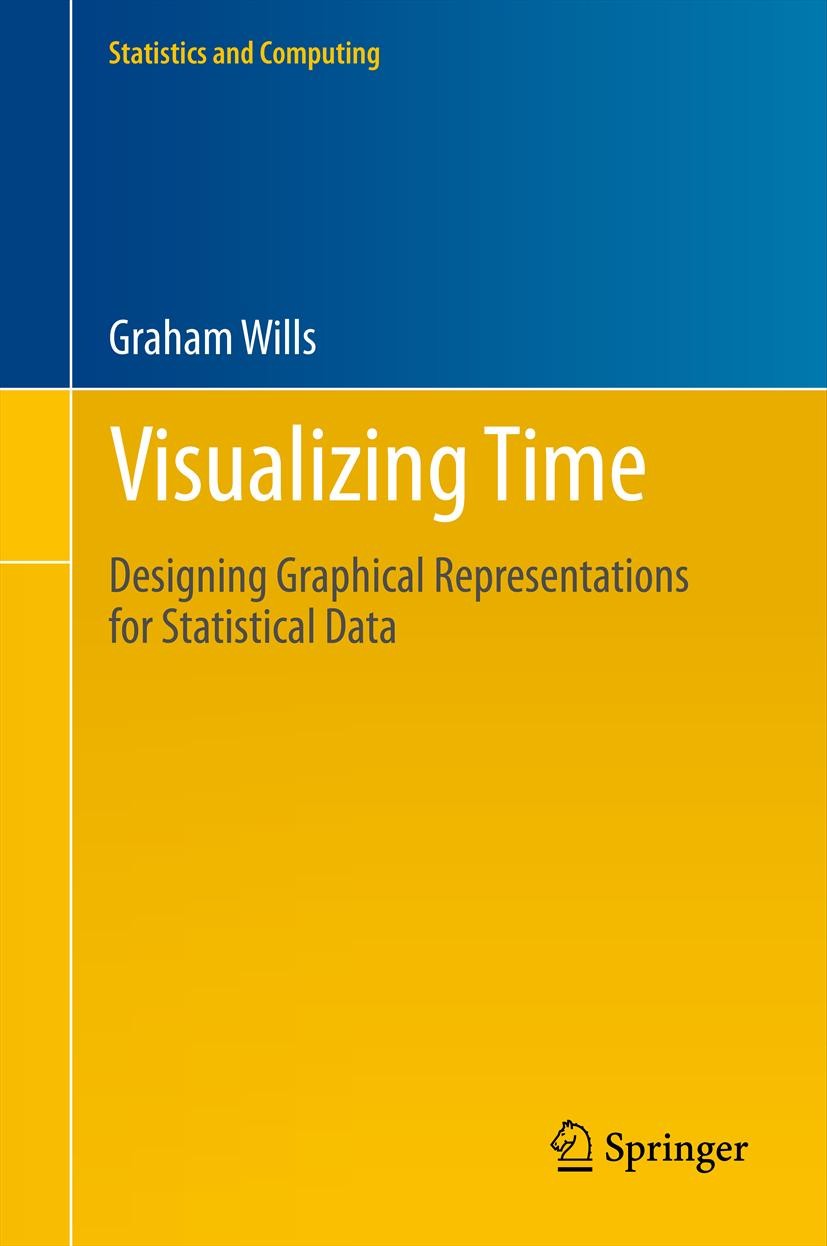
| 书目名称 | Visualizing Time | | 副标题 | Designing Graphical | | 编辑 | Graham Wills | | 视频video | http://file.papertrans.cn/984/983890/983890.mp4 | | 概述 | Contains over 100 figures, many in color.All new text and material.A go-to reference for how to visualize time.Includes supplementary material: | | 丛书名称 | Statistics and Computing | | 图书封面 |  | | 描述 | .Art, or Science? Which of these is the right way to think of the field of visualization? This is not an easy question to answer, even for those who have many years experience in making graphical depictions of data with a view to help people understand it and take action. In this book, Graham Wills bridges the gap between the art and the science of visually representing data. He does not simply give rules and advice, but bases these on general principles and provide a clear path between them . .This book is concerned with the graphical representation of time data and is written to cover a range of different users. A visualization expert designing tools for displaying time will find it valuable, but so also should a financier assembling a report in a spreadsheet, or a medical researcher trying to display gene sequences using a commercial statistical package.. | | 出版日期 | Book 2012 | | 关键词 | Time Series Analysis | | 版次 | 1 | | doi | https://doi.org/10.1007/978-0-387-77907-2 | | isbn_softcover | 978-1-4939-3924-4 | | isbn_ebook | 978-0-387-77907-2Series ISSN 1431-8784 Series E-ISSN 2197-1706 | | issn_series | 1431-8784 | | copyright | The Editor(s) (if applicable) and The Author(s), under exclusive license to Springer Science+Busines |
The information of publication is updating

|
|
 |Archiver|手机版|小黑屋|
派博传思国际
( 京公网安备110108008328)
GMT+8, 2025-12-27 10:19


