找回密码
 To register

QQ登录

只需一步,快速开始

扫一扫,访问微社区

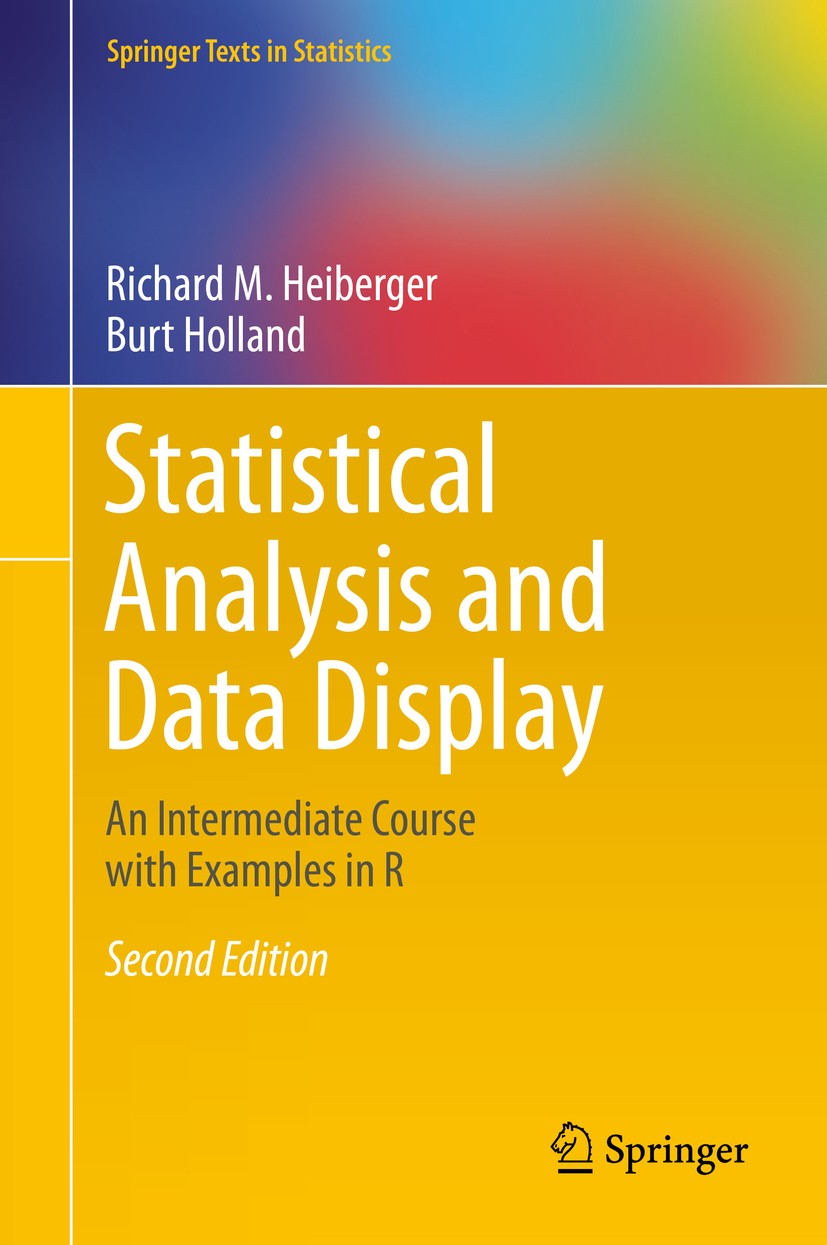
Titlebook: Statistical Analysis and Data Display; An Intermediate Cour Richard M. Heiberger,Burt Holland Textbook 2015Latest edition Springer Science+

[复制链接]
查看: 16413|回复: 63
发表于 2025-3-21 18:47:01 | 显示全部楼层 |阅读模式
书目名称Statistical Analysis and Data Display
副标题An Intermediate Cour
编辑Richard M. Heiberger,Burt Holland
视频video
概述le, and Text Editing Tools).Reproducibility: all graphs and tables in the book can be reproduced in R by the user with scripts included in the HH package available from CRAN and all datasets used in t
丛书名称Springer Texts in Statistics
图书封面Titlebook: Statistical Analysis and Data Display; An Intermediate Cour Richard M. Heiberger,Burt Holland Textbook 2015Latest edition Springer Science+
描述.This contemporary presentation of statistical methods features extensive use of graphical displays for exploring data and for displaying the analysis. The authors demonstrate how to analyze data—showing code, graphics, and accompanying tabular listings—for all the methods they cover. Complete R scripts for all examples and figures are provided for readers to use as models for their own analyses..This book can serve as a standalone text for statistics majors at the master’s level and for other quantitatively oriented disciplines at the doctoral level, and as a reference book for researchers. Classical concepts and techniques are illustrated with a variety of case studies using both newer graphical tools and traditional tabular displays..New graphical material includes:.an expanded chapter on graphics.a section on graphing Likert Scale Data to build on the importance of rating scales in fields from population studies to psychometrics.a discussion on design of graphics that will work for readers with color-deficient vision.an expanded discussion on the design of multi-panel graphics.expanded and new sections in the discrete bivariate statistics capter on the use of mosaic plots for c
出版日期Textbook 2015Latest edition
关键词Design of experiments; Graphical Design; Graphical Display Textbook; Introduction to probability and in
版次2
doihttps://doi.org/10.1007/978-1-4939-2122-5
isbn_softcover978-1-4939-7968-4
isbn_ebook978-1-4939-2122-5Series ISSN 1431-875X Series E-ISSN 2197-4136
issn_series 1431-875X
copyrightSpringer Science+Business Media, LLC, part of Springer Nature 2015
The information of publication is updating

书目名称Statistical Analysis and Data Display影响因子(影响力)


书目名称Statistical Analysis and Data Display影响因子(影响力)学科排名


书目名称Statistical Analysis and Data Display网络公开度


书目名称Statistical Analysis and Data Display网络公开度学科排名


书目名称Statistical Analysis and Data Display被引频次


书目名称Statistical Analysis and Data Display被引频次学科排名


书目名称Statistical Analysis and Data Display年度引用


书目名称Statistical Analysis and Data Display年度引用学科排名


书目名称Statistical Analysis and Data Display读者反馈


书目名称Statistical Analysis and Data Display读者反馈学科排名


单选投票, 共有 1 人参与投票
 

0票 0.00%

Perfect with Aesthetics


0票 0.00%

Better Implies Difficulty


1票 100.00%

Good and Satisfactory


0票 0.00%

Adverse Performance


0票 0.00%

Disdainful Garbage

您所在的用户组没有投票权限
发表于 2025-3-21 23:21:24 | 显示全部楼层
发表于 2025-3-22 03:24:30 | 显示全部楼层
发表于 2025-3-22 04:56:02 | 显示全部楼层
发表于 2025-3-22 12:19:43 | 显示全部楼层
发表于 2025-3-22 14:03:53 | 显示全部楼层
,Multiple Regression—Dummy Variables, Contrasts, and Analysis of Covariance,riables are usually based on a set of contrasts. The algebra of individual contrast vectors is discussed in Section . Many software procedures and functions make explicit use of this form of expression. Here we explore this equivalence of different representations of the contrasts associated with a
发表于 2025-3-22 19:48:13 | 显示全部楼层
发表于 2025-3-23 00:02:44 | 显示全部楼层
Two-Way Analysis of Variance,compare the changes in the mean of the response variable attributable to the various levels of this factor. Here we extend this to situations where there are two factors. In Chapters . and . we will discuss instances where there are more than two factors.
发表于 2025-3-23 01:59:11 | 显示全部楼层
,Design of Experiments—Factorial Designs,y Analysis of Variance”, discusses designs with two factors. More generally, we speak of “three-way” or “higher-way” designs and talk about main effects (one factor), two-way interactions (two factors), three-way interactions, four-way interactions, and so forth. Factors can have crossed or nested r
发表于 2025-3-23 07:35:59 | 显示全部楼层
 关于派博传思  派博传思旗下网站  友情链接
派博传思介绍 公司地理位置 论文服务流程 影响因子官网 SITEMAP 大讲堂 北京大学 Oxford Uni. Harvard Uni.
发展历史沿革 期刊点评 投稿经验总结 SCIENCEGARD IMPACTFACTOR 派博系数 清华大学 Yale Uni. Stanford Uni.
|Archiver|手机版|小黑屋| 派博传思国际 ( 京公网安备110108008328) GMT+8, 2025-5-6 10:17
Copyright © 2001-2015 派博传思   京公网安备110108008328 版权所有 All rights reserved
快速回复 返回顶部 返回列表