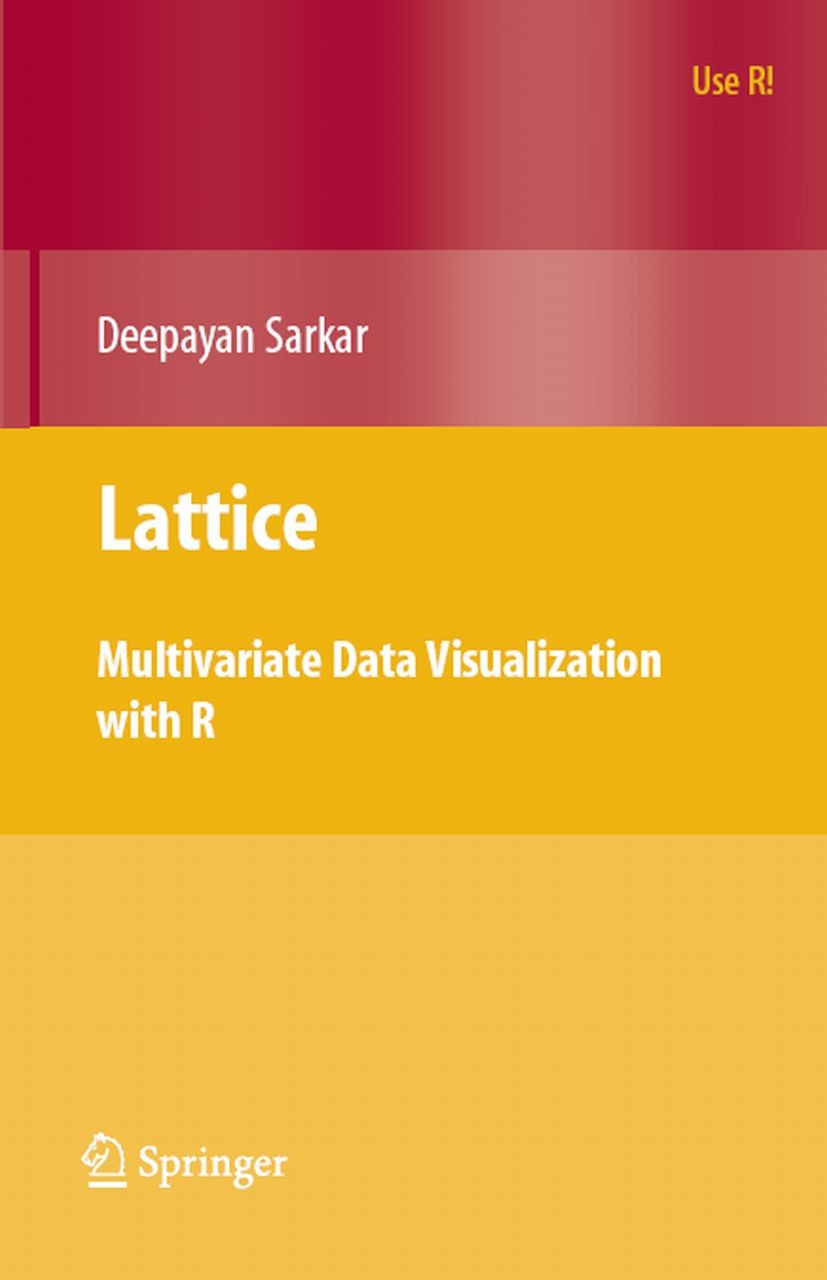
| 书目名称 | Lattice |
| 副标题 | Multivariate Data Vi |
| 编辑 | Deepayan Sarkar |
| 视频video | http://file.papertrans.cn/582/581925/581925.mp4 |
| 概述 | Gives a comprehensive overview of the Lattice graphics system and shows how to use it effectively.Includes numerous examples using data sets from various R packages.All code and figures including colo |
| 丛书名称 | Use R! |
| 图书封面 |  |
| 描述 | .R is rapidly growing in popularity as the environment of choice for data analysis and graphics both in academia and industry. Lattice brings the proven design of Trellis graphics (originally developed for S by William S. Cleveland and colleagues at Bell Labs) to R, considerably expanding its capabilities in the process. Lattice is a powerful and elegant high level data visualization system that is sufficient for most everyday graphics needs, yet flexible enough to be easily extended to handle demands of cutting edge research. Written by the author of the lattice system, this book describes it in considerable depth, beginning with the essentials and systematically delving into specific low levels details as necessary. No prior experience with lattice is required to read the book, although basic familiarity with R is assumed. The book contains close to 150 figures produced with lattice. Many of the examples emphasize principles of good graphical design; almost all use real data sets that are publicly available in various R packages. All code and figures in the book are also available online, along with supplementary material covering more advanced topics. . |
| 出版日期 | Book 2008 |
| 关键词 | Data Visualization; Graph; Lattice; R Graphics; Trellis; data analysis; visualization |
| 版次 | 1 |
| doi | https://doi.org/10.1007/978-0-387-75969-2 |
| isbn_softcover | 978-0-387-75968-5 |
| isbn_ebook | 978-0-387-75969-2Series ISSN 2197-5736 Series E-ISSN 2197-5744 |
| issn_series | 2197-5736 |
| copyright | Springer-Verlag New York 2008 |
 |Archiver|手机版|小黑屋|
派博传思国际
( 京公网安备110108008328)
GMT+8, 2026-2-8 04:21


