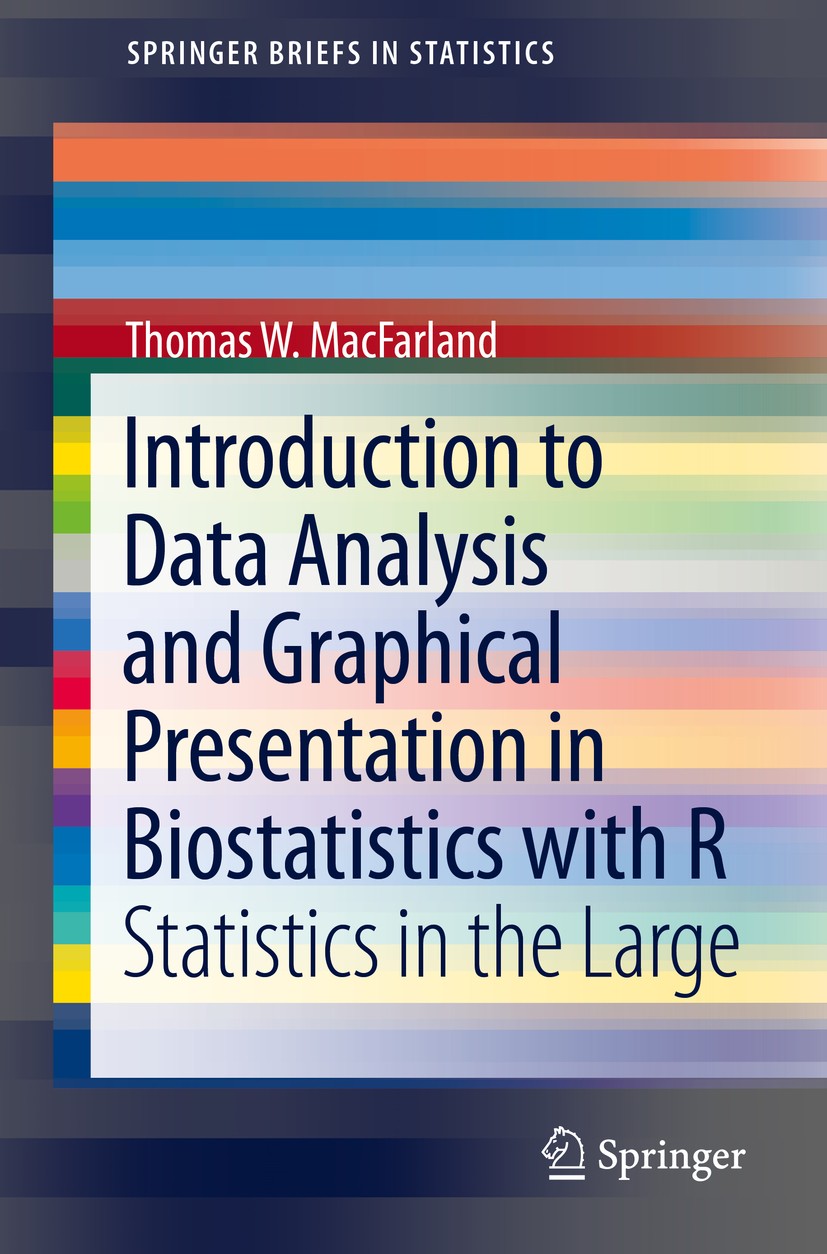
| 书目名称 | Introduction to Data Analysis and Graphical Presentation in Biostatistics with R | | 副标题 | Statistics in the La | | 编辑 | Thomas W. MacFarland | | 视频video | http://file.papertrans.cn/474/473591/473591.mp4 | | 概述 | Includes supplementary material: | | 丛书名称 | SpringerBriefs in Statistics | | 图书封面 |  | | 描述 | .Through real-world datasets, this book shows the reader how to work with material in biostatistics using the open source software R. These include tools that are critical to dealing with missing data, which is a pressing scientific issue for those engaged in biostatistics. Readers will be equipped to run analyses and make graphical presentations based on the sample dataset and their own data. The hands-on approach will benefit students and ensure the accessibility of this book for readers with a basic understanding of R. .Topics include: an introduction to Biostatistics and R, data exploration, descriptive statistics and measures of central tendency, t-Test for independent samples, t-Test for matched pairs, ANOVA, correlation and linear regression, and advice for future work.. | | 出版日期 | Book 2014 | | 关键词 | ANOVA; Biostatistics; Biostatistics with R; Graphical analysis; R; Regression | | 版次 | 1 | | doi | https://doi.org/10.1007/978-3-319-02532-2 | | isbn_softcover | 978-3-319-02531-5 | | isbn_ebook | 978-3-319-02532-2Series ISSN 2191-544X Series E-ISSN 2191-5458 | | issn_series | 2191-544X | | copyright | The Author(s) 2014 |
The information of publication is updating

|
|
 |Archiver|手机版|小黑屋|
派博传思国际
( 京公网安备110108008328)
GMT+8, 2026-2-10 00:22


