找回密码
 To register

QQ登录

只需一步,快速开始

扫一扫,访问微社区

Titlebook: Handbook of Data Visualization; Chun-houh Chen,Wolfgang Härdle,Antony Unwin Book 2008 Springer-Verlag Berlin Heidelberg 2008 Analysis.Clus

[复制链接]
查看: 48977|回复: 55
发表于 2025-3-21 18:55:38 | 显示全部楼层 |阅读模式
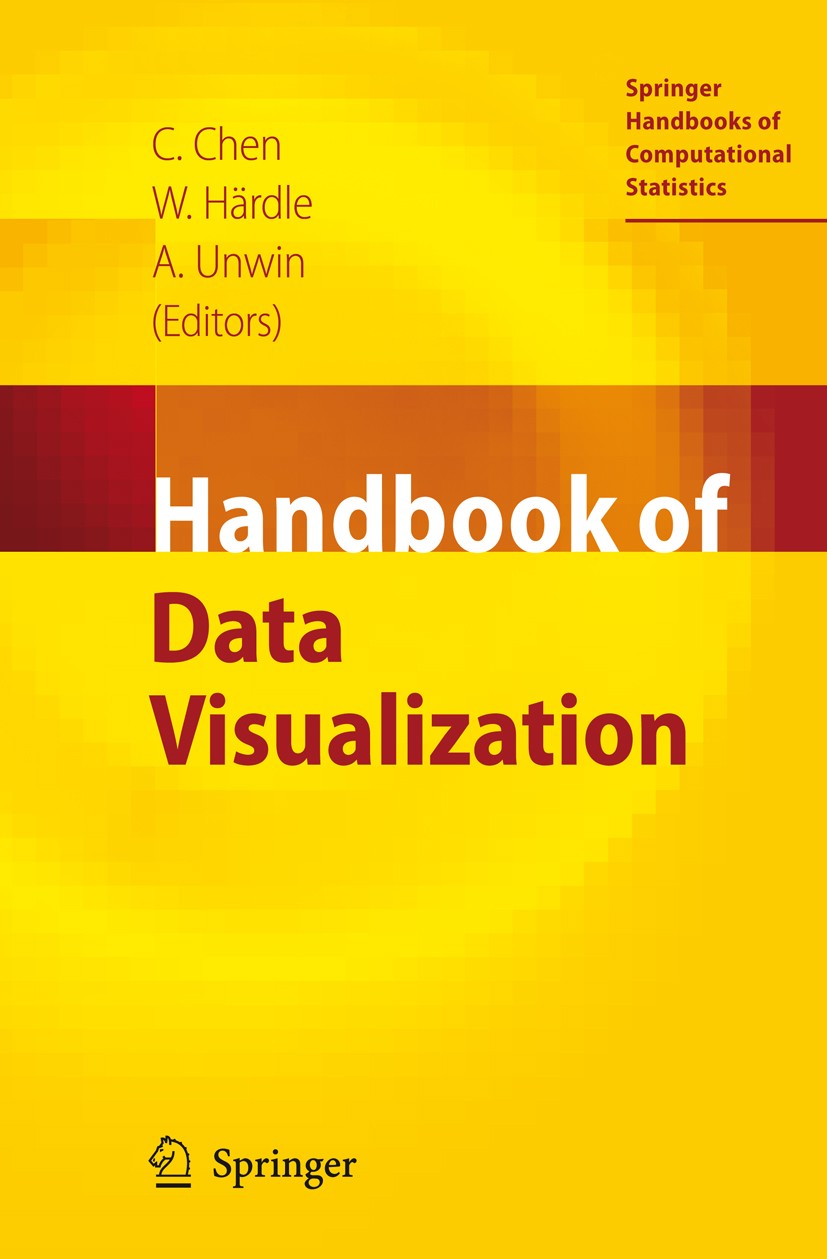
书目名称Handbook of Data Visualization
编辑Chun-houh Chen,Wolfgang Härdle,Antony Unwin
视频video
概述Complete overview of data visualization.Comprehensive coverage of the field, both in theory and practice.Includes supplementary material:
丛书名称Springer Handbooks of Computational Statistics
图书封面Titlebook: Handbook of Data Visualization;  Chun-houh Chen,Wolfgang Härdle,Antony Unwin Book 2008 Springer-Verlag Berlin Heidelberg 2008 Analysis.Clus
描述Antony Unwin, Chun-houh Chen, Wolfgang K. Härdle 1. 1 Computational Statistics and Data Visualization . . . . . . . . . . . . . . . . . . . . . . . . . . . 4 Data Visualization and Theory . . . . . . . . . . . . . . . . . . . . . . . . . . . . . . . . . . . . . . . . . . . . . . . . . . . . . . . . . . . . . . . . . 4 Presentation and Exploratory Graphics . . . . . . . . . . . . . . . . . . . . . . . . . . . . . . . . . . . . . . . . . . . . . . . . . . . . 4 Graphics and Computing . . . . . . . . . . . . . . . . . . . . . . . . . . . . . . . . . . . . . . . . . . . . . . . . . . . . . . . . . . . . . . . . . . . . . . . . 5 1. 2 The Chapters . . . . . . . . . . . . . . . . . . . . . . . . . . . . . . . . . . . . . . . . . . . . . . . . . . . . . . . . . . . . . . . . . . . . . . . . . . . . . . . . . . . . . . . 6 Summary and Overview; Part II. . . . . . . . . . . . . . . . . . . . . . . . . . . . . . . . . . . . . . . . . . . . . . . . . . . . . . . . . . . . . . . . 7 Summary and Overview; Part III. . . . . . . . . . . . . . . . . . . . . . . . . . . . . . . . . . . . . . . . . . . . . . . . . . . . . . . . . . . . . . . 9 Summary and Overview; Part IV . . . . . . . . . . . . .
出版日期Book 2008
关键词Analysis; Cluster analysis; Fitting; Java; Projection pursuit; XML; best fit; computer; data analysis; multid
版次1
doihttps://doi.org/10.1007/978-3-540-33037-0
isbn_softcover978-3-662-50074-3
isbn_ebook978-3-540-33037-0Series ISSN 2197-9790 Series E-ISSN 2197-9804
issn_series 2197-9790
copyrightSpringer-Verlag Berlin Heidelberg 2008
The information of publication is updating

书目名称Handbook of Data Visualization影响因子(影响力)


书目名称Handbook of Data Visualization影响因子(影响力)学科排名


书目名称Handbook of Data Visualization网络公开度


书目名称Handbook of Data Visualization网络公开度学科排名


书目名称Handbook of Data Visualization被引频次


书目名称Handbook of Data Visualization被引频次学科排名


书目名称Handbook of Data Visualization年度引用


书目名称Handbook of Data Visualization年度引用学科排名


书目名称Handbook of Data Visualization读者反馈


书目名称Handbook of Data Visualization读者反馈学科排名


单选投票, 共有 1 人参与投票
 

0票 0.00%

Perfect with Aesthetics


1票 100.00%

Better Implies Difficulty


0票 0.00%

Good and Satisfactory


0票 0.00%

Adverse Performance


0票 0.00%

Disdainful Garbage

您所在的用户组没有投票权限
发表于 2025-3-22 00:19:07 | 显示全部楼层
发表于 2025-3-22 01:39:32 | 显示全部楼层
发表于 2025-3-22 06:14:32 | 显示全部楼层
Visualizing Trees and Forestsquently used tree-basedmodels are classification, regression, and survival trees. Visualization is important in conjunction with treemodels because in their graphical formthey are easily interpretable even without special knowledge. Interpretation of decision trees displayed as a hierarchy of decision rules is highly intuitive.
发表于 2025-3-22 10:24:01 | 显示全部楼层
https://doi.org/10.1007/978-3-662-42551-0r of sources. Examples of new technologies giving rise to large, high-dimensional data sets are high-throughput genomic and proteomic technologies, sensor-based monitoring systems, etc. Finally, new application areas such as biochemical pathways, web documents, etc. produce data with inherent . that cannot be simply captured by numbers.
发表于 2025-3-22 15:38:18 | 显示全部楼层
Unsere Hoffnungen, unsere Zukunftnts as the markers in a scatterplot, the bars of a histogram, or even an entire line plot. However, a narrower definition would not be sufficient to capture the wide range of data visualization techniques that have been developed over the centuries that are termed glyphs.
发表于 2025-3-22 17:49:11 | 显示全部楼层
https://doi.org/10.1007/978-3-663-05509-9 a 2-D coordinate system by using a datareductionmethod such as principal component analysis, projection pursuit, multidimensional scaling, or correspondence analysis. .3. Use a nonorthogonal coordinate system such as parallel coordinates which is less restricted by the two-dimensionality of paper. .4. Link low-dimensional displays.
发表于 2025-3-22 23:38:07 | 显示全部楼层
发表于 2025-3-23 05:09:08 | 显示全部楼层
Multivariate Data Glyphs: Principles and Practicents as the markers in a scatterplot, the bars of a histogram, or even an entire line plot. However, a narrower definition would not be sufficient to capture the wide range of data visualization techniques that have been developed over the centuries that are termed glyphs.
发表于 2025-3-23 06:15:33 | 显示全部楼层
Linked Views for Visual Exploration a 2-D coordinate system by using a datareductionmethod such as principal component analysis, projection pursuit, multidimensional scaling, or correspondence analysis. .3. Use a nonorthogonal coordinate system such as parallel coordinates which is less restricted by the two-dimensionality of paper. .4. Link low-dimensional displays.
 关于派博传思  派博传思旗下网站  友情链接
派博传思介绍 公司地理位置 论文服务流程 影响因子官网 SITEMAP 大讲堂 北京大学 Oxford Uni. Harvard Uni.
发展历史沿革 期刊点评 投稿经验总结 SCIENCEGARD IMPACTFACTOR 派博系数 清华大学 Yale Uni. Stanford Uni.
|Archiver|手机版|小黑屋| 派博传思国际 ( 京公网安备110108008328) GMT+8, 2025-5-7 19:42
Copyright © 2001-2015 派博传思   京公网安备110108008328 版权所有 All rights reserved
快速回复 返回顶部 返回列表