找回密码
 To register

QQ登录

只需一步,快速开始

扫一扫,访问微社区

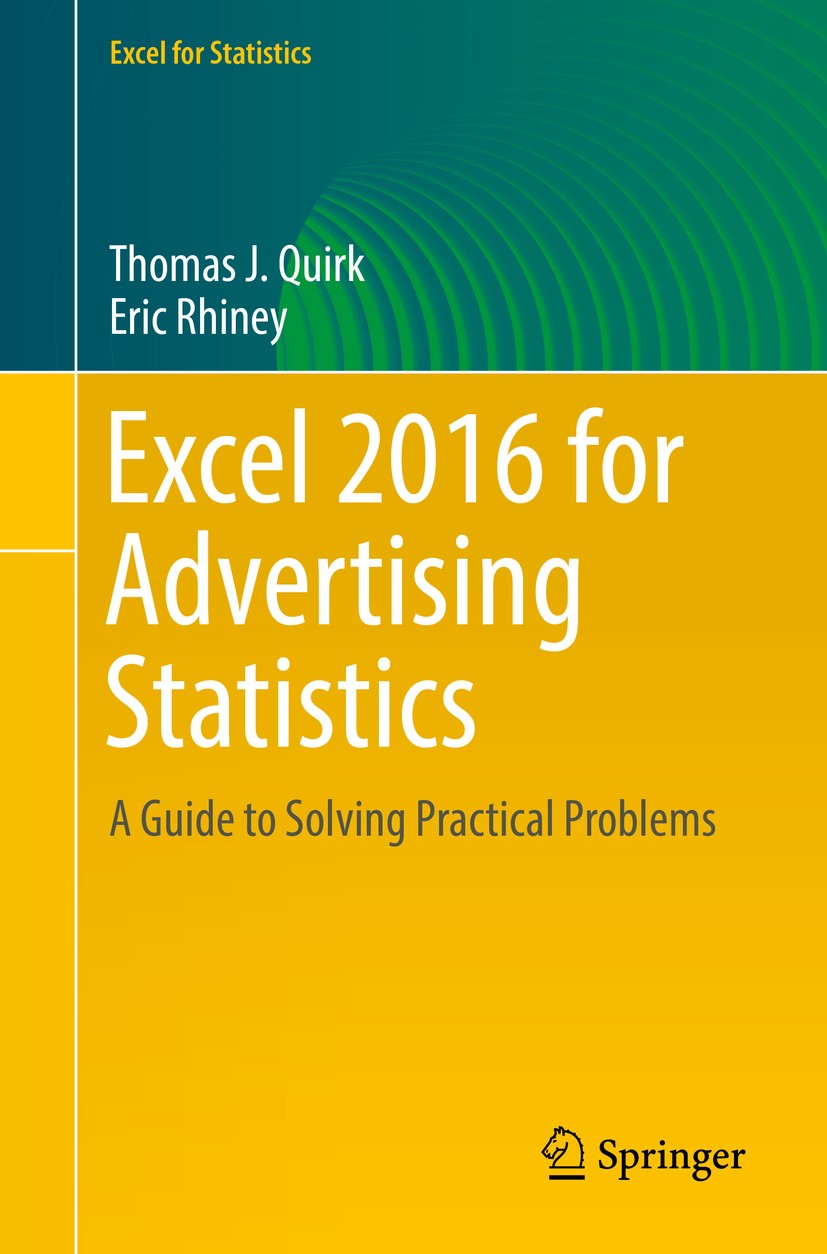
Titlebook: Excel 2016 for Advertising Statistics; A Guide to Solving P Thomas J. Quirk,Eric Rhiney Textbook 20171st edition Springer International Pub

[复制链接]
查看: 54987|回复: 43
发表于 2025-3-21 19:03:24 | 显示全部楼层 |阅读模式
书目名称Excel 2016 for Advertising Statistics
副标题A Guide to Solving P
编辑Thomas J. Quirk,Eric Rhiney
视频video
概述Presents key steps and examples to solve practical, easy-to-understand advertising problems using Excel 2016.Contains 167 illustrations in color.Suitable for undergraduate and graduate students.No bac
丛书名称Excel for Statistics
图书封面Titlebook: Excel 2016 for Advertising Statistics; A Guide to Solving P Thomas J. Quirk,Eric Rhiney Textbook 20171st edition Springer International Pub
描述.This text is a step-by-step guide for students taking a first course in statistics for advertising and for advertising managers and practitioners who want to learn how to use Excel to solve practical statistics problems in in the workplace, whether or not they have taken a course in statistics..Excel 2016 for Advertising Statistics .explains statistical formulas and offers practical examples for how students can solve real-world advertising statistics problems. This book leaves detailed explanations of statistical theory to other statistics textbooks and focuses entirely on practical, real-world problem solving..Each chapter briefly explains a topic and then demonstrates how to use Excel commands and formulas to solve specific advertising statistics problems.  This book gives practice in using Excel in two different ways:  (1) writing formulas (e.g., confidence interval about the mean, one-group t-test, two-group t-test, correlation) and (2) using Excel’s drop-downformula menus (e.g., simple linear regression, multiple correlation and multiple regression, and one-way ANOVA).  Three practice problems are provided at the end of each chapter, along with their solutions in an Appendix
出版日期Textbook 20171st edition
关键词Excel 2016; Standard Deviation; Sample Size; Standard Error of the Mean; Random Number Generator; Confide
版次1
doihttps://doi.org/10.1007/978-3-319-72104-0
isbn_ebook978-3-319-72104-0Series ISSN 2570-4605 Series E-ISSN 2570-4613
issn_series 2570-4605
copyrightSpringer International Publishing AG 2017
The information of publication is updating

书目名称Excel 2016 for Advertising Statistics影响因子(影响力)


书目名称Excel 2016 for Advertising Statistics影响因子(影响力)学科排名


书目名称Excel 2016 for Advertising Statistics网络公开度


书目名称Excel 2016 for Advertising Statistics网络公开度学科排名


书目名称Excel 2016 for Advertising Statistics被引频次


书目名称Excel 2016 for Advertising Statistics被引频次学科排名


书目名称Excel 2016 for Advertising Statistics年度引用


书目名称Excel 2016 for Advertising Statistics年度引用学科排名


书目名称Excel 2016 for Advertising Statistics读者反馈


书目名称Excel 2016 for Advertising Statistics读者反馈学科排名


单选投票, 共有 0 人参与投票
 

0票 0%

Perfect with Aesthetics


0票 0%

Better Implies Difficulty


0票 0%

Good and Satisfactory


0票 0%

Adverse Performance


0票 0%

Disdainful Garbage

您所在的用户组没有投票权限
发表于 2025-3-21 20:34:22 | 显示全部楼层
发表于 2025-3-22 02:53:36 | 显示全部楼层
发表于 2025-3-22 05:09:51 | 显示全部楼层
One-Group t-Test for the Mean, the 95% confidence interval about the mean (Chap. 3) and the one-group t-test is explained. Three practice problems are given at the end of the chapter to test your Excel skills, and the answers to these problems appear in Appendix A of this book. An additional practice problem is presented in the
发表于 2025-3-22 11:06:38 | 显示全部楼层
Two-Group t-Test of the Difference of the Means for Independent Groups,tical example. Three practice problems are given at the end of the chapter to test your Excel skills, and the answers to these problems appear in Appendix . of this book. An additional practice problem is presented in the Practice Test given in Appendix . along with its answer in Appendix . of this
发表于 2025-3-22 15:22:47 | 显示全部楼层
发表于 2025-3-22 17:48:05 | 显示全部楼层
Multiple Correlation and Multiple Regression,o write the multiple regression equation for the data. Finally, the Excel commands needed to find the correlation between all of the variables are explained so that you can create a “correlation matrix” for your data set. You will learn how to read this correlation matrix to determine the correlatio
发表于 2025-3-23 00:45:34 | 显示全部楼层
One-Way Analysis of Variance (ANOVA),s to see if they are “significantly different from each other.” If this overall ANOVA test is produces a significant result, you will learn how to test the hypotheses comparing any two groups using an ANOVA t-test formula. This formula is presented, explained, and a practical business example is use
发表于 2025-3-23 04:59:15 | 显示全部楼层
2570-4605 nus (e.g., simple linear regression, multiple correlation and multiple regression, and one-way ANOVA).  Three practice problems are provided at the end of each chapter, along with their solutions in an Appendix978-3-319-72104-0Series ISSN 2570-4605 Series E-ISSN 2570-4613
发表于 2025-3-23 06:00:56 | 显示全部楼层
https://doi.org/10.1007/978-1-84628-531-8ecific number of decimal places, how to save an Excel worksheet into your computer, and how to print out an Excel worksheet. Three practice problems are given at the end of the chapter to test your Excel skills, and the answers to these problems appear in Appendix A of this book. An additional pract
 关于派博传思  派博传思旗下网站  友情链接
派博传思介绍 公司地理位置 论文服务流程 影响因子官网 SITEMAP 大讲堂 北京大学 Oxford Uni. Harvard Uni.
发展历史沿革 期刊点评 投稿经验总结 SCIENCEGARD IMPACTFACTOR 派博系数 清华大学 Yale Uni. Stanford Uni.
|Archiver|手机版|小黑屋| 派博传思国际 ( 京公网安备110108008328) GMT+8, 2025-6-9 16:31
Copyright © 2001-2015 派博传思   京公网安备110108008328 版权所有 All rights reserved
快速回复 返回顶部 返回列表