找回密码
 To register

QQ登录

只需一步,快速开始

扫一扫,访问微社区

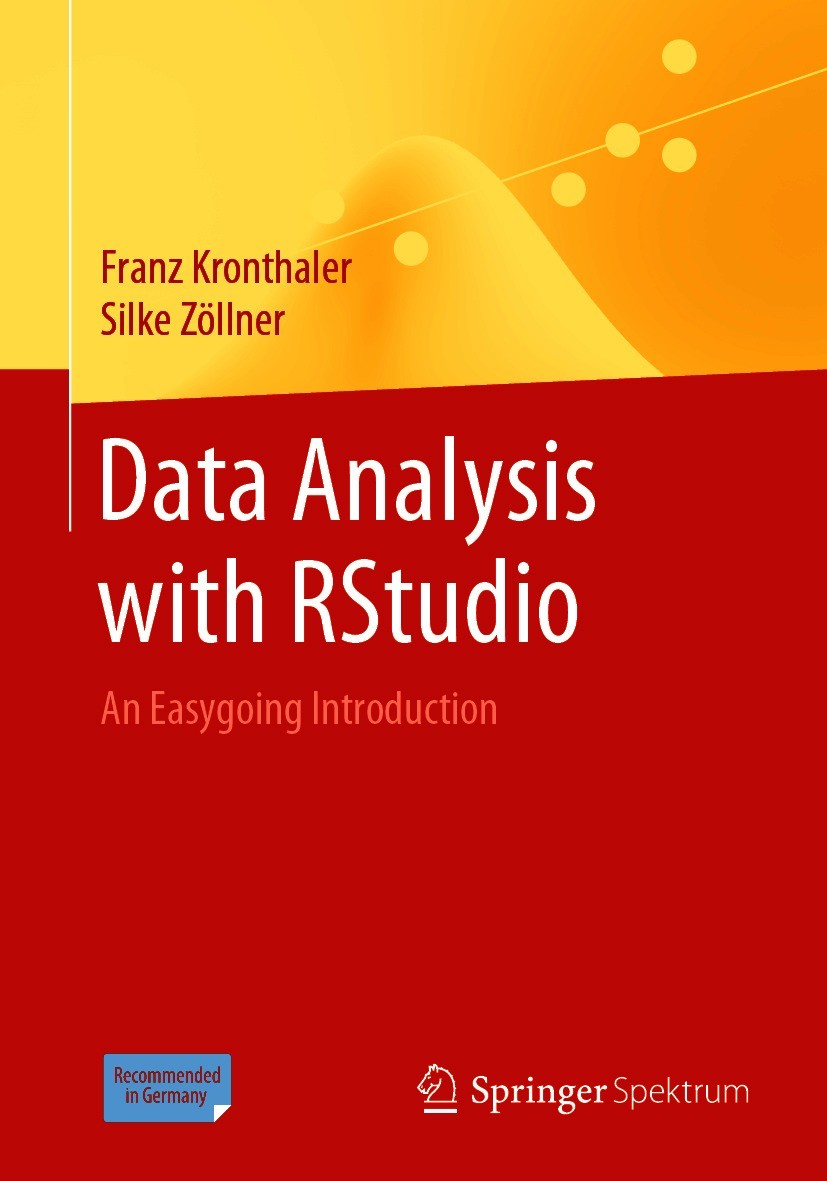
Titlebook: Data Analysis with RStudio; An Easygoing Introdu Franz Kronthaler,Silke Zöllner Textbook 2021 The Editor(s) (if applicable) and The Author(

[复制链接]
查看: 27968|回复: 45
发表于 2025-3-21 17:25:09 | 显示全部楼层 |阅读模式
书目名称Data Analysis with RStudio
副标题An Easygoing Introdu
编辑Franz Kronthaler,Silke Zöllner
视频videohttp://file.papertrans.cn/263/262669/262669.mp4
概述Shows how RStudio can easily be used for data analysis.Includes descriptive statistics, creating graphics, testing hypotheses, ANOVA and regression with RStudio.Provides exercises with solutions.Recom
图书封面Titlebook: Data Analysis with RStudio; An Easygoing Introdu Franz Kronthaler,Silke Zöllner Textbook 2021 The Editor(s) (if applicable) and The Author(
描述​The objective of this text is to introduce RStudio to practitioners and students and enable them to use R in their everyday work. It is not a statistical textbook, the purpose is to transmit the joy of analyzing data with RStudio. Practitioners and students learn how RStudio can be installed and used, they learn to import data, write scripts and save working results. Furthermore, they learn to employ descriptive statistics and create graphics with RStudio. Additionally, it is shown how RStudio can be used to test hypotheses, run an analysis of variance and regressions. To deepen the learned content, tasks are included with the solutions provided at the end of the textbook. This textbook has been recommended and developed for university courses in Germany, Austria and Switzerland..
出版日期Textbook 2021
关键词RStudio; describing and analyzing data with RStudio; ggplot2; testing hypotheses with RStudio; linear re
版次1
doihttps://doi.org/10.1007/978-3-662-62518-7
isbn_softcover978-3-662-62517-0
isbn_ebook978-3-662-62518-7
copyrightThe Editor(s) (if applicable) and The Author(s), under exclusive license to Springer-Verlag GmbH, DE
The information of publication is updating

书目名称Data Analysis with RStudio影响因子(影响力)


书目名称Data Analysis with RStudio影响因子(影响力)学科排名


书目名称Data Analysis with RStudio网络公开度


书目名称Data Analysis with RStudio网络公开度学科排名


书目名称Data Analysis with RStudio被引频次


书目名称Data Analysis with RStudio被引频次学科排名


书目名称Data Analysis with RStudio年度引用


书目名称Data Analysis with RStudio年度引用学科排名


书目名称Data Analysis with RStudio读者反馈


书目名称Data Analysis with RStudio读者反馈学科排名


单选投票, 共有 0 人参与投票
 

0票 0%

Perfect with Aesthetics


0票 0%

Better Implies Difficulty


0票 0%

Good and Satisfactory


0票 0%

Adverse Performance


0票 0%

Disdainful Garbage

您所在的用户组没有投票权限
发表于 2025-3-21 20:17:17 | 显示全部楼层
发表于 2025-3-22 01:10:33 | 显示全部楼层
发表于 2025-3-22 08:26:47 | 显示全部楼层
https://doi.org/10.1007/978-3-658-41728-4This chapter shows you how to investigate your data with descriptive key figures like mean, variance and correlation coefficient. It then illustrates how you can construct and plot graphs like histograms, boxplots and scatterplots.
发表于 2025-3-22 11:03:53 | 显示全部楼层
Oliver Adam,Wolfgang Beck,Ilona NordThis chapter introduces you to four possibilities to check if your variable is normally distributed in RStudio. This is often a prerequisite for statistical methods.
发表于 2025-3-22 14:58:14 | 显示全部楼层
发表于 2025-3-22 17:55:09 | 显示全部楼层
Einführung zum methodischen VorgehenWe hope that this script has awakened your interest in data analysis. Of course, this is only a first introduction and there is still much to discover.
发表于 2025-3-22 23:13:36 | 显示全部楼层
https://doi.org/10.1007/978-3-319-34144-6Whenever we collect data ourselves or use secondary data, it might happen that we have missing values. If, for example, a participant in our survey does not answer a question, this value is missing. How do we deal with it?
发表于 2025-3-23 03:34:56 | 显示全部楼层
R and RStudio,This chapter introduces you to R and RStudio and explains all you need to know to get started. It starts with downloading R and RStudio and gives you an overview of the screen. It then shows how to work with scripts and packages.
发表于 2025-3-23 06:24:16 | 显示全部楼层
Data Analysis Basics with RStudio,This chapter explains how you import data into RStudio and how you can have a first look at your data. It then shows how to create or modify data and select cases. The chapter then illustrates important commands and shows how to write scripts and create reports.
 关于派博传思  派博传思旗下网站  友情链接
派博传思介绍 公司地理位置 论文服务流程 影响因子官网 吾爱论文网 大讲堂 北京大学 Oxford Uni. Harvard Uni.
发展历史沿革 期刊点评 投稿经验总结 SCIENCEGARD IMPACTFACTOR 派博系数 清华大学 Yale Uni. Stanford Uni.
QQ|Archiver|手机版|小黑屋| 派博传思国际 ( 京公网安备110108008328) GMT+8, 2025-8-21 14:50
Copyright © 2001-2015 派博传思   京公网安备110108008328 版权所有 All rights reserved
快速回复 返回顶部 返回列表