找回密码
 To register

QQ登录

只需一步,快速开始

扫一扫,访问微社区

Titlebook: Data Analysis in Management with SPSS Software; J.P. Verma Textbook 2013 Springer India 2013 Cluster Analysis.Factor Analysis.Logistic Reg

[复制链接]
查看: 45101|回复: 50
发表于 2025-3-21 19:12:17 | 显示全部楼层 |阅读模式
书目名称Data Analysis in Management with SPSS Software
编辑J.P. Verma
视频video
概述A self learning text for the use of SPSS software in data analysis.It helps in understanding the application of advanced statistical techniques by using SPSS and interpreting the findings.Simple appro
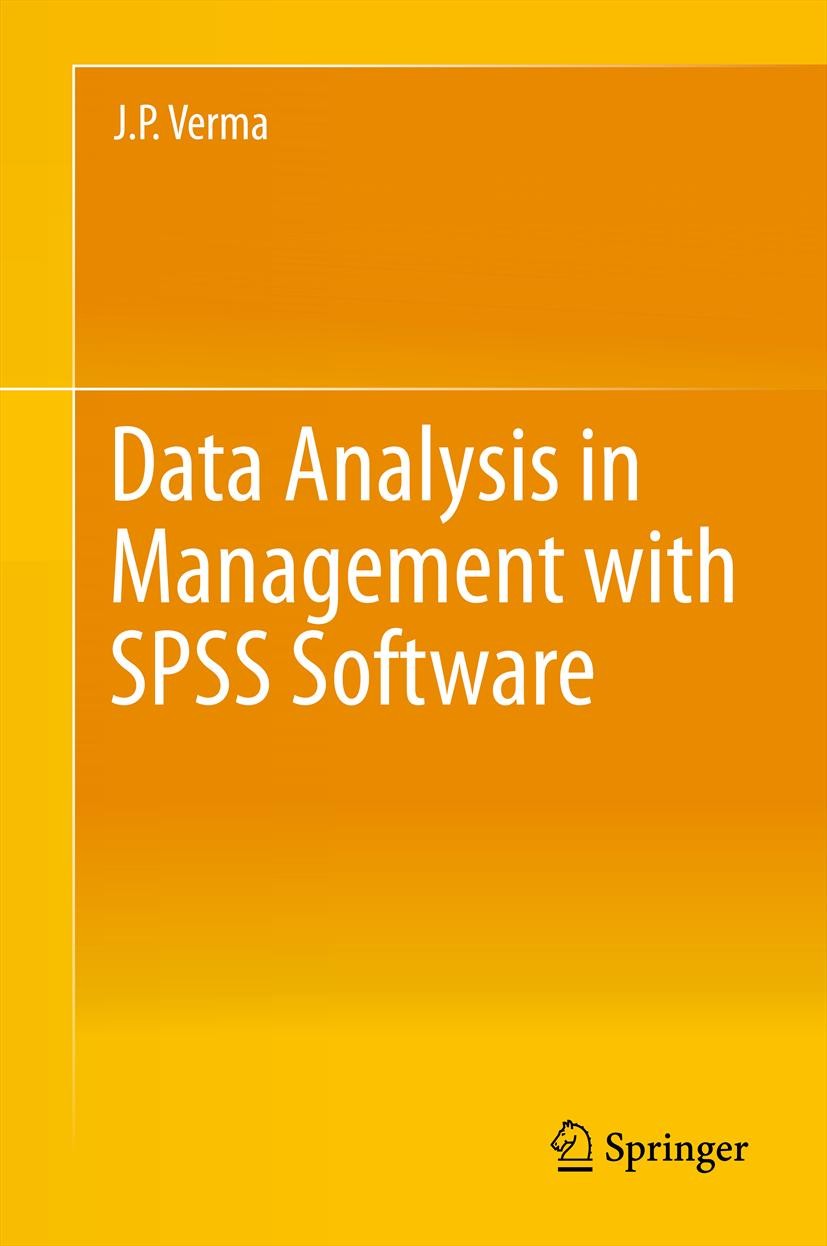
图书封面Titlebook: Data Analysis in Management with SPSS Software;  J.P. Verma Textbook 2013 Springer India 2013 Cluster Analysis.Factor Analysis.Logistic Reg
描述This book provides readers with a greater understanding of a variety of statistical techniques along with the procedure to use the most popular statistical software package SPSS. It strengthens the intuitive understanding of the material, thereby increasing the ability to successfully analyze data in the future. The book provides more control in the analysis of data so that readers can apply the techniques to a broader spectrum of research problems. This book focuses on providing readers with the knowledge and skills needed to carry out research in management, humanities, social and behavioural sciences by using SPSS.
出版日期Textbook 2013
关键词Cluster Analysis; Factor Analysis; Logistic Regression; Multivariate Analysis; SPSS
版次1
doihttps://doi.org/10.1007/978-81-322-0786-3
isbn_softcover978-81-322-1710-7
isbn_ebook978-81-322-0786-3
copyrightSpringer India 2013
The information of publication is updating

书目名称Data Analysis in Management with SPSS Software影响因子(影响力)


书目名称Data Analysis in Management with SPSS Software影响因子(影响力)学科排名


书目名称Data Analysis in Management with SPSS Software网络公开度


书目名称Data Analysis in Management with SPSS Software网络公开度学科排名


书目名称Data Analysis in Management with SPSS Software被引频次


书目名称Data Analysis in Management with SPSS Software被引频次学科排名


书目名称Data Analysis in Management with SPSS Software年度引用


书目名称Data Analysis in Management with SPSS Software年度引用学科排名


书目名称Data Analysis in Management with SPSS Software读者反馈


书目名称Data Analysis in Management with SPSS Software读者反馈学科排名


单选投票, 共有 0 人参与投票
 

0票 0%

Perfect with Aesthetics


0票 0%

Better Implies Difficulty


0票 0%

Good and Satisfactory


0票 0%

Adverse Performance


0票 0%

Disdainful Garbage

您所在的用户组没有投票权限
发表于 2025-3-21 22:15:58 | 显示全部楼层
Descriptive Analysis,now or be able to describe the characteristics of an organization that implement flexible working timing or that have a certain working culture. Descriptive studies may be undertaken to describe the characteristics of a group of employees in an organization. The purpose of descriptive studies is to
发表于 2025-3-22 01:26:56 | 显示全部楼层
发表于 2025-3-22 06:22:16 | 显示全部楼层
Correlation Matrix and Partial Correlation: Explaining Relationships,les that affect it. Once these variables are identified, an effective strategy may be adopted by prioritizing it to enhance the productivity in the organization. For instance, if a company needs to improve the sale of a product, then its first priority would be to ensure its quality and then to impr
发表于 2025-3-22 10:18:37 | 显示全部楼层
Regression Analysis and Multiple Correlations: For Estimating a Measurable Phenomenon,developed between dependent and independent variables by means of least square method. When the estimation is done on the basis of one independent variable, the procedure is known as simple regression, and if the estimation involves more than one independent variable, it is referred to as multiple r
发表于 2025-3-22 15:06:26 | 显示全部楼层
Hypothesis Testing for Decision-Making,tive. Subjective decisions are solely based upon one’s own perception of viewing issues. These perceptions keep on changing from person to person. Same thing or situation can be perceived differently by different persons, and therefore, the decision cannot be universalized. On the other hand, if dec
发表于 2025-3-22 20:38:31 | 显示全部楼层
One-Way ANOVA: Comparing Means of More than Two Samples, different groups have been drawn from the same population. It is abbreviated as one-way ANOVA. This technique can be used in a situation where the data is measured either at interval scale or ratio scale. In one-way ANOVA, group means are compared by comparing the variability between groups with th
发表于 2025-3-22 22:18:46 | 显示全部楼层
发表于 2025-3-23 04:55:09 | 显示全部楼层
发表于 2025-3-23 08:55:34 | 显示全部楼层
 关于派博传思  派博传思旗下网站  友情链接
派博传思介绍 公司地理位置 论文服务流程 影响因子官网 SITEMAP 大讲堂 北京大学 Oxford Uni. Harvard Uni.
发展历史沿革 期刊点评 投稿经验总结 SCIENCEGARD IMPACTFACTOR 派博系数 清华大学 Yale Uni. Stanford Uni.
|Archiver|手机版|小黑屋| 派博传思国际 ( 京公网安备110108008328) GMT+8, 2025-5-4 18:21
Copyright © 2001-2015 派博传思   京公网安备110108008328 版权所有 All rights reserved
快速回复 返回顶部 返回列表